Blog Entries finance
16 Posts
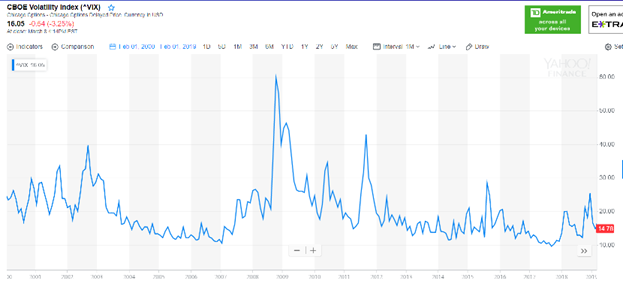
Looking at the VIX volatility index, we see regular spikes in volatility that almost look like something that can be predicted or at least expected to occur at somewhat regular intervals. This paper looks at whether we can predict those spikes and whether we can profit off of them by buying options.
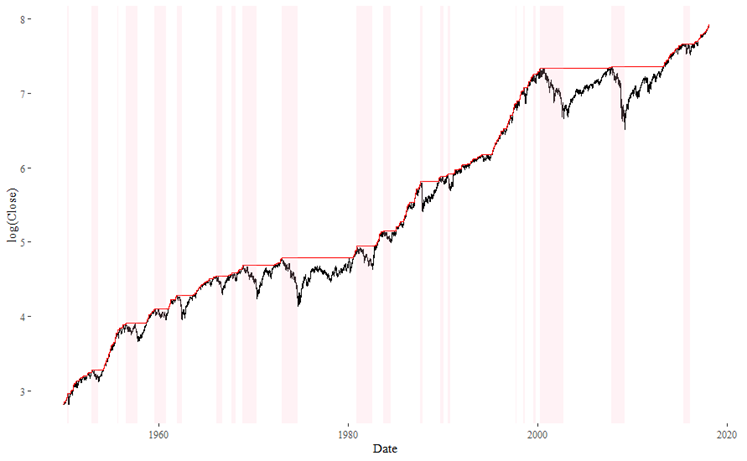
Examines market drawdowns since 1950 where the overall market (as measured by the S&P 500) fell by 10% or more.
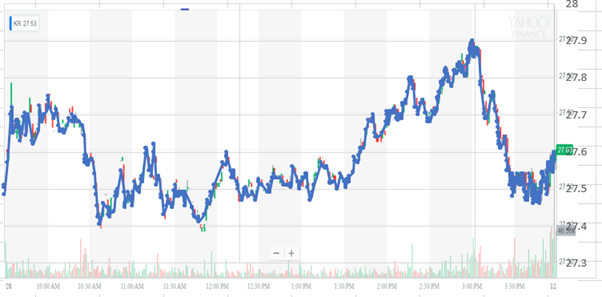
An analysis of the detailed intraday trading data that IEX provides for free. The analysis shows that while IEX only represents 2% of the overall stock market activity, the data can still provides minute-level details for 500-1000 of the most actively traded stocks.
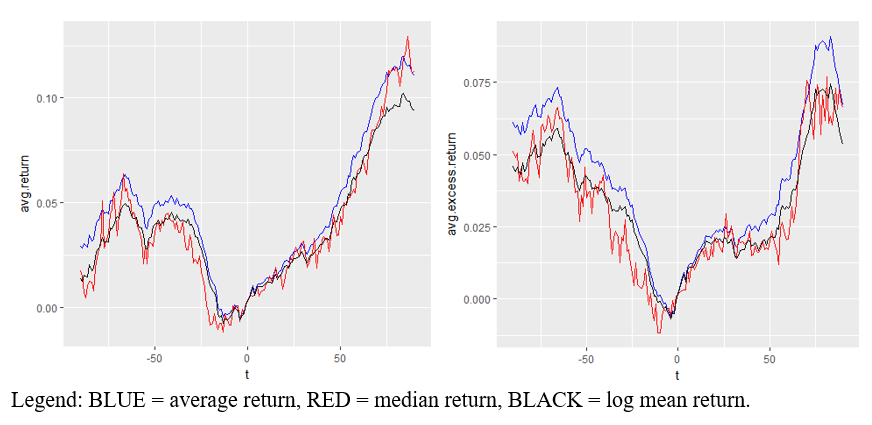
We examine a set of 167 stocks that announced stock repurchase programs in the past year. On average, we see that these stocks increased in value by 5% after 50 days and 10-15% after 90 days (2.5% and 7.5% on a market-adjusted basis). This implies that buying stocks quickly after they announce a repurchase program could be a valuable strategy.
The paper revisits a portfolio selection model that picks the top performing stocks historically and hopes they continue to perform well. This time we improve the method by limiting the amount of volatility we allow in these stocks.
The attached paper looks at real-world options pricing data and tries to use this to infer the probability distribution of expected returns. The method proposed does not seem to be ideal, but it provides one method for looking at options prices to see if these can be used to predict future prices and is able to produce sensible predictions for the value of the stock examined.
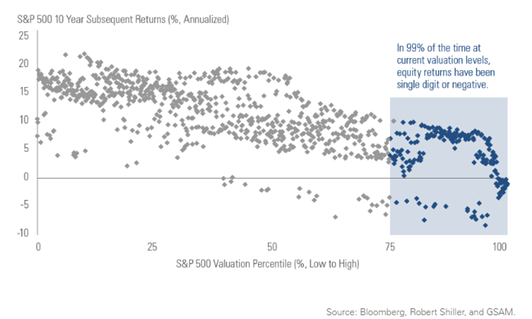
A simple regression of S&P 500 results compared with levels of Shiller's P/E ratio shows that there is a strong correlation between long-term returns and P/E ratios. The results are strongest at the 24-, 30-, 36-, and 42-month range. At current P/E levels (28.96) the models we build actually predict a negative return of about 2.5% over the next couple of years.
This paper revisits a prior portfolio selection strategy that invests in the top-performing stocks in the market and rebalances regularly. While the strategy initially looked profitable during the period it was examined, this analysis using 10 years of data shows that it is not profitable in the long run. Using risk-adjusted metrics like the Sharpe or Sortino ratios shows the strategies are also more risky. A warning is included about the importance of measuring log returns versus simple average returns.
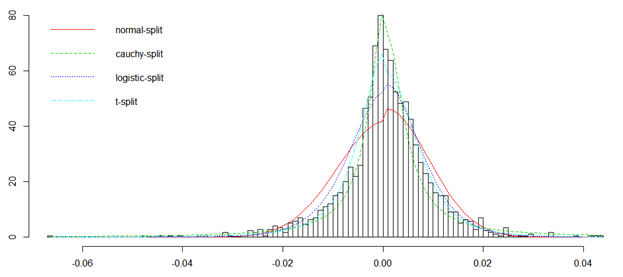
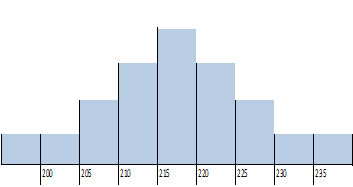
A t-distribution and a "split" t-distribution are shown to be good models for stock returns. A distribution is fit to real-world data and used to infer theoretical prices for call and put options. These theoretical prices are compared to market prices and differences are discussed.
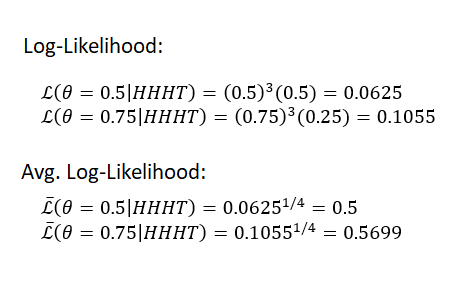
Average log-likelihood is a good way to measure how well distributions fit a set of data. Using the average (instead of the raw log-likelihood corrects for errors in the more commonly used BIC and AIC measures. It also has an intuitive meaning that is explained in this paper.
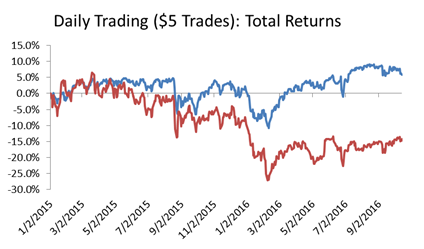
This paper analyzes a simple stock selection methodology and focuses on the impact of trading costs to this strategy. Even $5 trading costs can destroy the value of a good trading strategy if you trade too often or trade with a small bankroll.
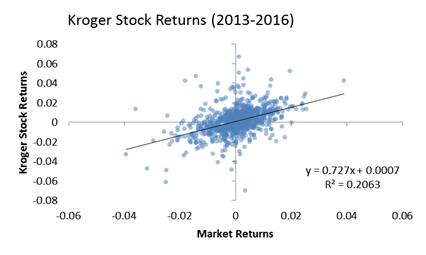
This analysis performs the typical linear regression of individual stocks against a broader portfolio of stocks to determine alpha, beta, and measures assessing "goodness of fit" for these models (p-values for coefficients and the overall R-squared values). Overall, about 33.5% of a stock's price change are due to the overall market rather than factors affecting the individual stock.
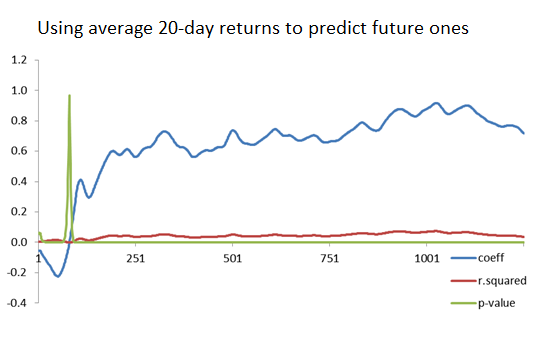
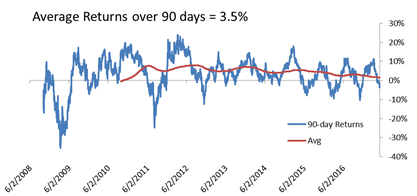
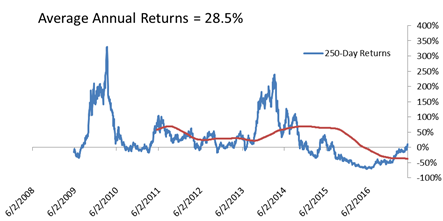
This paper examines the S&P 500 to see if past returns can be used to predict future ones. 1-day, 5-day, 20-day (monthly), and 250-day (annual) returns are examined. The best model emerges when we try to predict annual returns using historical returns averaged over multiple years of data. The short-term models show interesting features (such as short-term returns being negatively correlated), but they do not score high in predictive power.
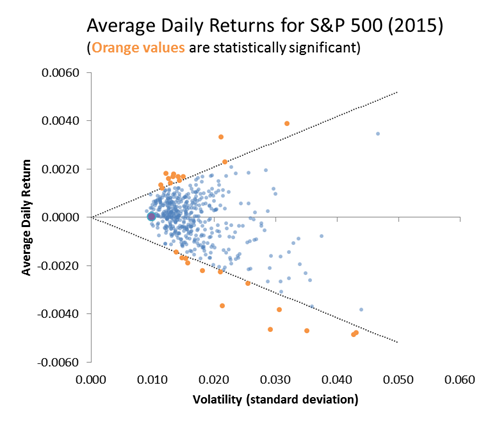
This analysis looks at whether stock returns are statistically significant or if they are essentially random noise. When looking at just a year or two's worth of data the returns do in fact appear indistinguishable from random noise. Over a five year period, more stocks meet the requirement for statistical significance but a large part of the market still looks like random noise.
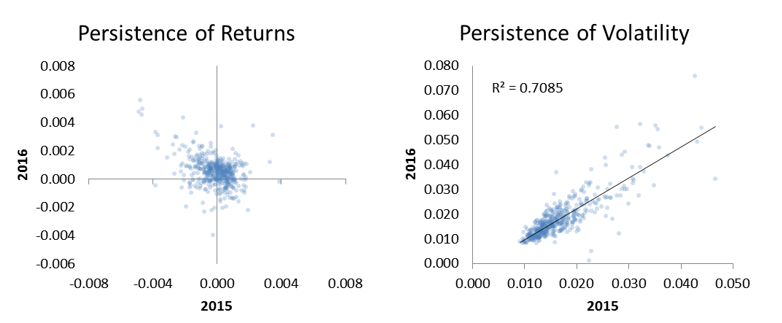
Analysis of stock data showing that while excess returns are not persistent features from year year to year, volatility is persistent. We can identify volatile stocks based on previous performance with a high degree of confidence. However, last year's stock performance tells us little about what its performance will be next year.
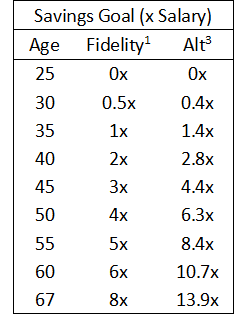
One of the most important analyses I have ever done. This uses a simulation and optimization approach to determine how much money you need to save in order to have a comfortable, secure retirement. It includes investment goals by age and looks at how those investments should be diversified and moved from aggressive stock investments into safer bonds and t-bills as you approach retirement.